Seven Connectors, One Quiet Bill: Scoring Integration Debt in UK Mid-Market Operations
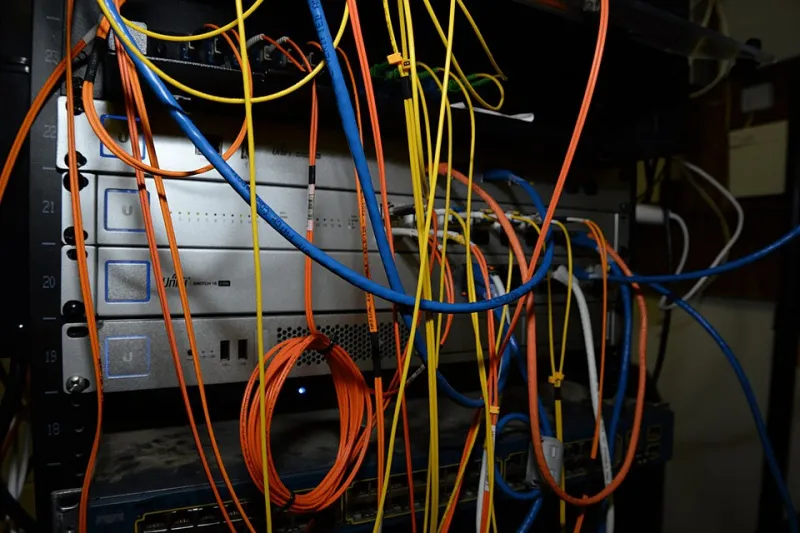
Photo: Federal Bureau of Investigation, Public domain, via Wikimedia Commons
Integration debt has a peculiar quality in UK mid-market operations: it is approved as small change and paid for as permanent overhead. A project board sees a spreadsheet bridge, a batch job or a vendor connector as a minor delivery detail. The run organisation then inherits the licence, the support burden, the reconciliation effort and the key-person risk. No single line in the budget calls it integration debt, which is precisely why it persists.
The seven patterns below are not theoretical. They appear repeatedly in organisations that have grown through acquisition, replaced part of an ERP estate, adopted a best-of-breed service tool or extended a supplier portal. Individually, each looks manageable. Collectively, they raise the cost of running the business and slow the cycle of operational decision-making.
Why integration debt hides in run costs
Capital budgets favour new systems. Operating budgets absorb the connectors between them. A point-to-point link is often funded as a change request, then maintained by whichever team notices it first. Its cost appears as support time, batch monitoring, reconciliation hours, exception handling and delayed reporting rather than as an integration line item. For 2026 planning, UK operations leaders should treat these connectors as a portfolio, not as isolated technical artefacts.
The seven connectors
1. Spreadsheet bridges between finance and operations. A scheduled export, a macro-enabled workbook and a manual import become the de facto integration layer. The hidden costs are version control, rework after formula changes and the absence of an audit trail. The bridge usually has one expert who understands it and no documented owner.
2. Duplicate reconciliations across teams. Finance reconciles the ledger to the operational system, operations reconciles the same data to a supplier file, and a third team reconciles both to a management report. Each reconciliation has a purpose, but the overlap is rarely challenged. The cost is double work, disputed figures and slower close.
3. Overnight batch chains with fragile dependencies. Job A must finish before Job B, which feeds Job C, which must complete before the month-end window closes. When one job runs late, the whole chain slips. The cost appears as support cover, reruns and decisions taken on stale data. Batch is not inherently wrong, but undocumented dependency chains are.
4. Orphaned APIs with no named owner. An API was built for a project, the project closed, and the API remains in use by an unknown consumer. There is no contract, no monitoring and no decommission date. The cost is unexpected breakage, security exposure and time spent discovering who depends on it.
5. Vendor middleware sprawl. Multiple integration platforms, vendor-specific connectors and acquired estates leave the organisation supporting several middleware products with overlapping capability. Licence renewals, skills shortages and inconsistent monitoring all add to run cost.
6. Shared file drops and mailbox handoffs. An SFTP folder or a shared inbox acts as the interface between teams or suppliers. There is no schema enforcement, no alerting and no clear acknowledgement. The cost is silent failure: a file arrives, nobody processes it, and the exception is discovered at the next reconciliation.
7. Direct database links that bypass the integration layer. A reporting tool or a local application connects straight to an operational database. It works until a schema change or a patching window breaks it. The cost is hidden coupling, emergency fixes and a reluctance to upgrade the source system.
A simple scoring model
Score each connector from 1 to 5 on five dimensions. A higher score means greater debt or greater business consequence.
| Dimension | What to assess |
|---|---|
| Run effort | Support hours, monitoring and manual intervention per month |
| Exception volume | Frequency and severity of failed or repaired records |
| Change friction | How often system or process change breaks the connector |
| Ownership clarity | Reverse-score: 5 means no named owner or contract |
| Business criticality | Effect on revenue, compliance, month-end or service delivery |
Total the five scores for a range of 5 to 25. Treat 5 to 9 as monitor, 10 to 15 as remediate within twelve months, and 16 to 25 as immediate action. The bands are deliberately simple. The value lies in applying the same model consistently and reviewing the portfolio quarterly.
Reading the scores without over-reacting
A high criticality score does not automatically make a connector the first priority. A critical link with clear ownership, monitoring and a tested change process may be safer than a non-critical link that breaks weekly and has no owner. Use the total score to rank, then apply judgement: orphaned APIs and shared file drops tend to carry hidden security and failure risk, while spreadsheet bridges tend to carry hidden labour cost.
The audit should also capture volume. A connector that handles twelve records a month and one that handles twelve thousand both score on criticality, but their remediation cases differ. Record the transaction volume, the number of known consumers and the last successful change date alongside the score.
A remediation sequence that holds
- Stop new point-to-point links. Require an integration review for any new connection, including spreadsheet bridges and direct database links. This is a control, not a ban on delivery.
- Instrument the existing estate. Create a register with owner, consumers, contract, monitoring and decommission date. If an API has no owner, assign one before funding anything else.
- Consolidate duplicate reconciliations. Map overlapping reconciliations and agree a single controlled reconciliation per business event. Retire the duplicates deliberately.
- Harden or replace batch chains. Document dependencies and add alerting first. Replace with event-driven integration only where the business case is clear; otherwise make the batch schedule resilient.
- Retire orphaned APIs and unused middleware. Give every connector a review date. Decommission what has no consumer, and consolidate middleware where skills and licences overlap.
- Contract the remainder. For each surviving connector, define ownership, change notification, service expectations and an exit route. A connector without an owner is not an asset; it is an incident waiting for a date.
The aim is not to eliminate every point-to-point connection. Some are appropriate, especially in a mid-market estate where a full integration platform would be disproportionate. The aim is to make the run cost visible, assign it to a named owner and reduce the number of connectors that exist only because no one has challenged them.